
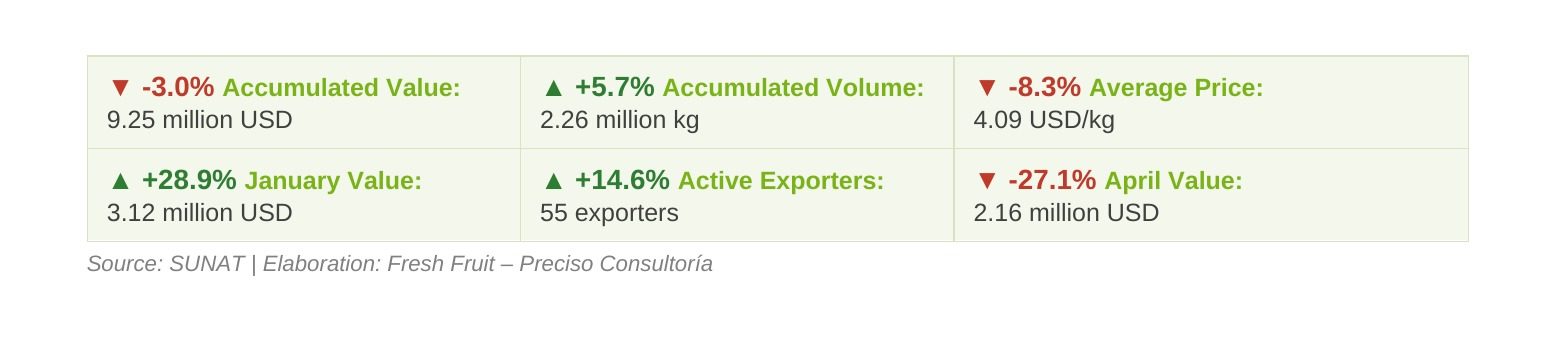
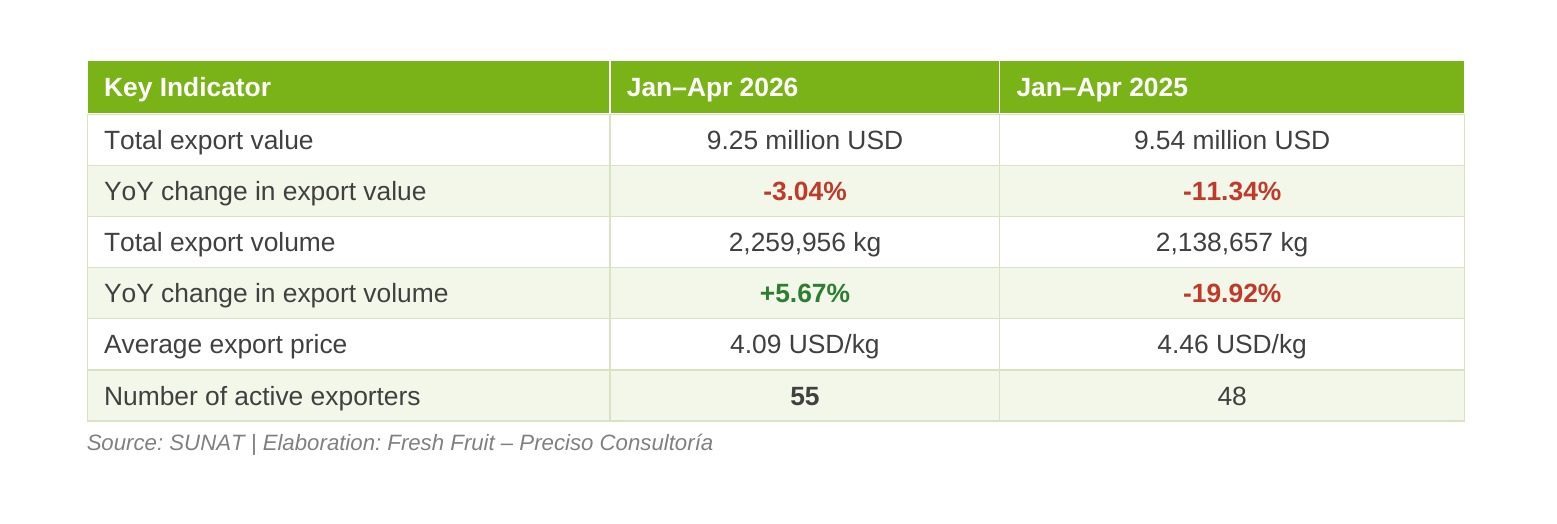
Between January and April 2026, Peruvian agricultural exports to Australia totalled 9.25 million USD, a decrease of 3.0% from 9.54 million USD during the same period in 2025. This decline in value occurred despite a 5.7% year-over-year increase in total export volume, from approximately 2.14 million kilograms to 2.26 million kilograms. The decrease in export value was therefore driven primarily by a lower average export price rather than by reduced shipment volume. The average export price fell from 4.46 USD per kilogram in January–April 2025 to 4.09 USD per kilogram in January–April 2026. This suggests that the export mix to Australia either shifted toward lower-value, higher-volume products, experienced softer pricing for key high-value exports, or reflected a combination of both factors. The number of active exporters nonetheless increased from 48 to 55, indicating broader participation among Peruvian companies serving the Australian market.
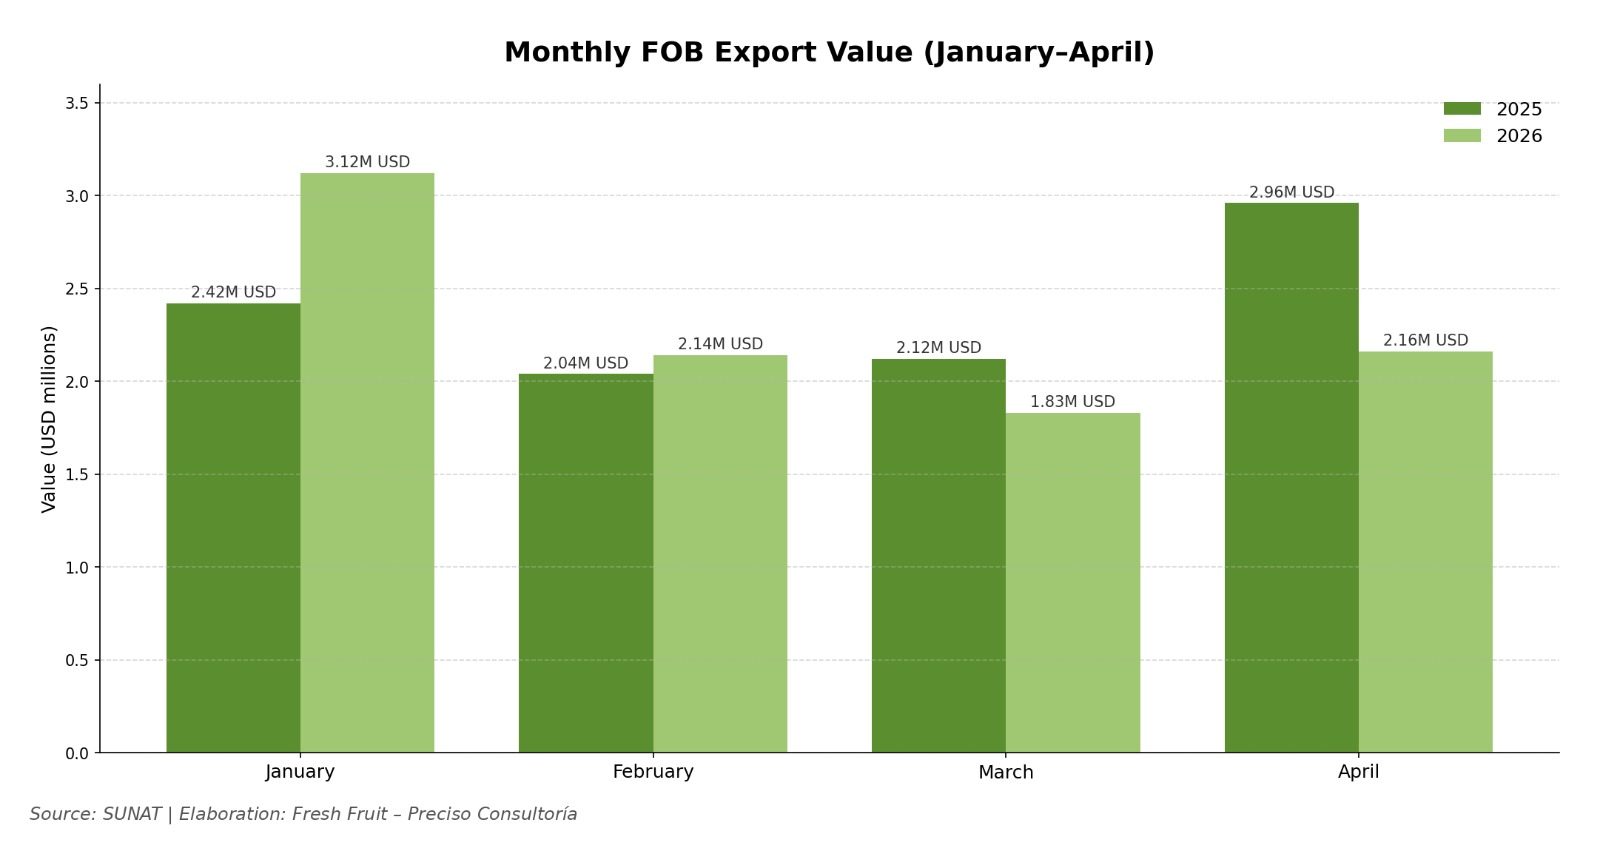
At the monthly level, January recorded the highest export value of the first four months of 2026, reaching 3.12 million USD, compared with 2.42 million USD in January 2025, a year-over-year increase of 28.9%. February also showed modest growth, edging up from 2.04 million USD to 2.14 million USD (+4.8%). In contrast, March and April recorded lower values than the previous year. March declined from 2.12 million USD to 1.83 million USD (-13.6%), while April fell more sharply from 2.96 million USD to 2.16 million USD (-27.1%). The January–April 2026 result was therefore supported mainly by a strong start to the year, with the momentum fading over the second and third months.
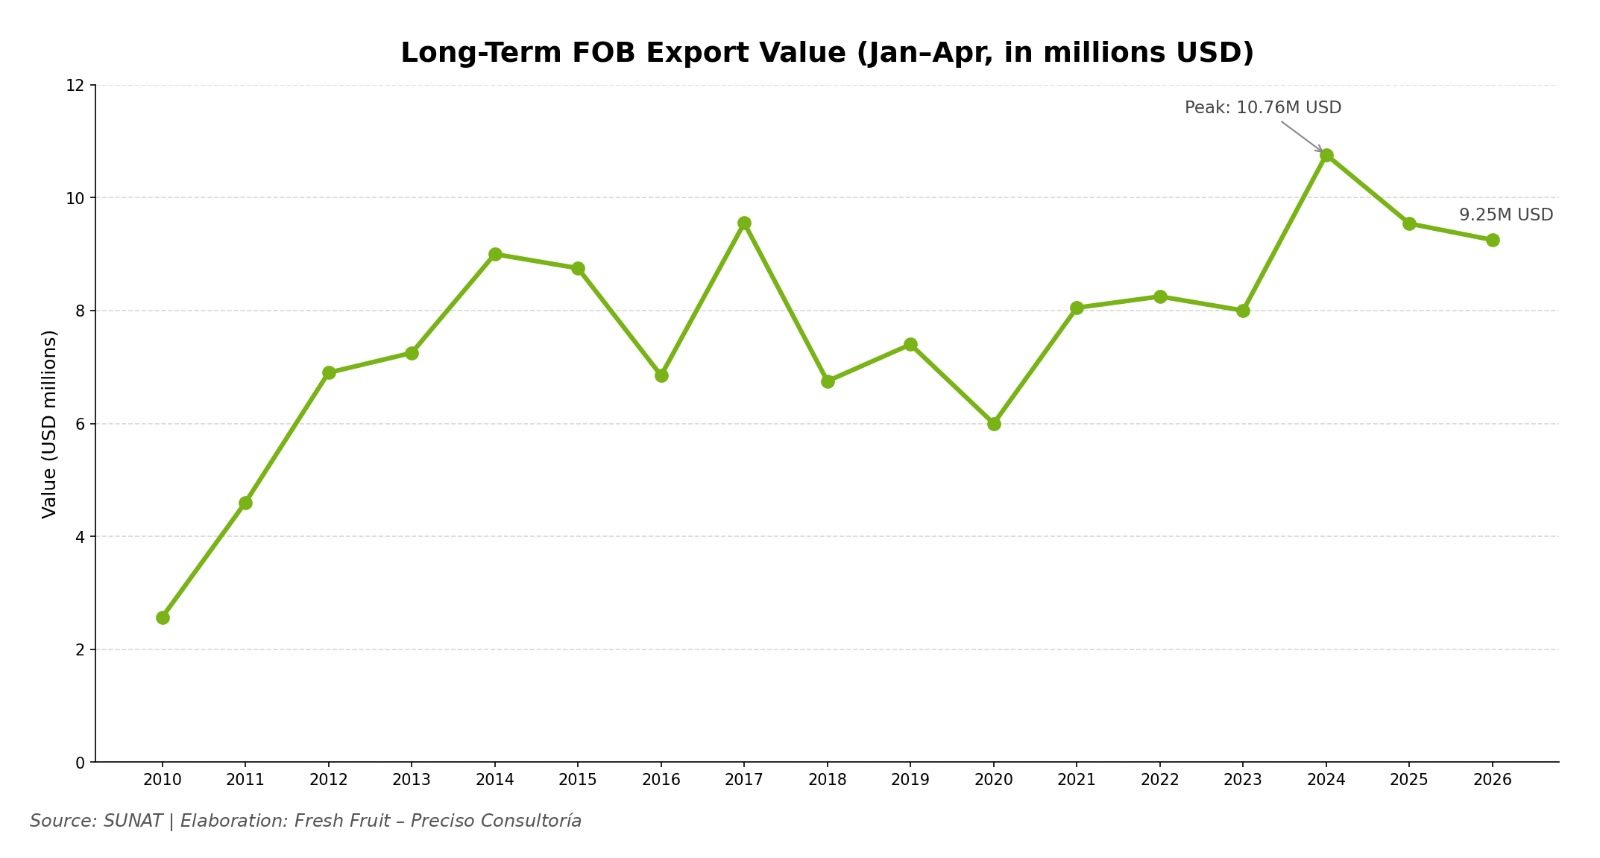
From a longer-term perspective, Peruvian exports to Australia during the January–April window have trended broadly upward since 2010, rising from 2.57 million USD in 2010 to a peak of 10.76 million USD in 2024. The series has not been linear: after reaching that 2024 high, exports eased to 9.54 million USD in 2025 and 9.25 million USD in 2026. Even so, the 2026 figure remains the third-highest on record for the period and roughly 3.6 times the 2010 level, indicating sustained structural expansion in the Peru–Australia agricultural corridor despite recent year-on-year softness.
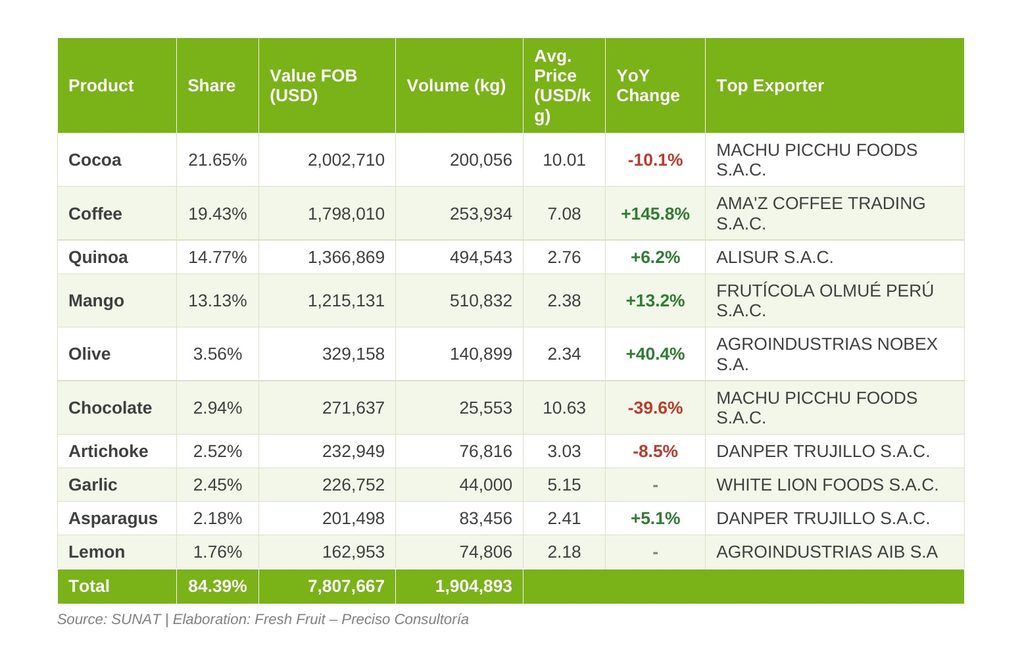
Between January and April 2026, Peru’s exports to Australia were led by a concentrated group of agricultural and food-based products. The ten main products accounted for roughly 84% of the total export value, indicating that the export basket was highly concentrated in a limited number of categories. Cocoa, coffee, quinoa, and mango alone accounted for 68.98% of total exports, making them the principal drivers of Peru’s trade performance with Australia during the period.
Cocoa ranked as the leading export product, with shipments totalling 2.00 million USD, equivalent to 21.65% of total exports. However, the category contracted 10.1% year-over-year, easing from 2.23 million USD in the same period of 2025. Coffee followed in second place with 1.80 million USD and a 19.43% share, and posted by far the strongest growth in the table, surging 145.8% from just 0.73 million USD a year earlier. This expansion lifted coffee from a secondary line to a co-leader of the basket, and its volume more than doubled, rising 166.5% to roughly 253,934 kilograms. Together, cocoa and coffee accounted for 41.08% of all Peruvian agricultural exports to Australia in the period.
Quinoa and mango occupied the third and fourth positions, with shares of 14.77% and 13.13% respectively. Quinoa exports reached 1.37 million USD, up 6.2% year-over-year, while mango rose 13.2% to 1.22 million USD. Both are higher-volume, lower-priced categories, with quinoa at 2.76 USD/kg and mango at 2.38 USD/kg, and their combined volume of roughly 1.01 million kilograms represented close to half of all volume shipped during the period, underscoring their role as the high-tonnage anchors of the basket.
Several mid-sized categories also contributed to overall performance. Olive exports reached 329,158 USD, a 40.4% increase year-over-year and the second-strongest growth rate in the table, while asparagus rose 5.1% to 201,498 USD. Garlic and lemon both appeared as new entrants to the top ten, with no recorded shipments in the same period of 2025, contributing 226,752 USD and 162,953 USD respectively. In contrast, chocolate fell 39.6% to 271,637 USD and artichoke declined 8.5% to 232,949 USD, the two largest contractions among continuing products.
Average export prices varied considerably across the top products. Chocolate recorded the highest average price at 10.63 USD/kg, followed closely by cocoa at 10.01 USD/kg, and then coffee at 7.08 USD/kg and garlic at 5.15 USD/kg. These higher-priced, value-added and specialty categories generated meaningful export value from comparatively modest volumes. By contrast, lemon, olive, mango, asparagus, and quinoa reflected larger-volume, lower-priced export profiles. The composition shows that Peru’s exports to Australia are anchored by non-perishable and processed goods, such as cocoa, coffee, quinoa, chocolate and olives, alongside a narrower set of fresh categories such as mango, asparagus, garlic and lemon.
Overall, Peru’s exports to Australia in January–April 2026 were led by cocoa and coffee in terms of value, with coffee, olive and the new garlic and lemon lines providing the strongest upward momentum, while cocoa, chocolate and artichoke weighed on the total. Taken together, the results indicate that the year-on-year dip in headline value masked a meaningful reshuffling of the basket toward coffee and a wider range of participating products and categories.
Peru’s top agricultural exports to Australia show distinct variation across the four periods analysed, reflecting the sharp seasonality of Peruvian agriculture and the timing of demand in the Australian market. While some products display clear cyclical behaviour tied to harvest windows, others provide steadier baselines in the trade relationship.
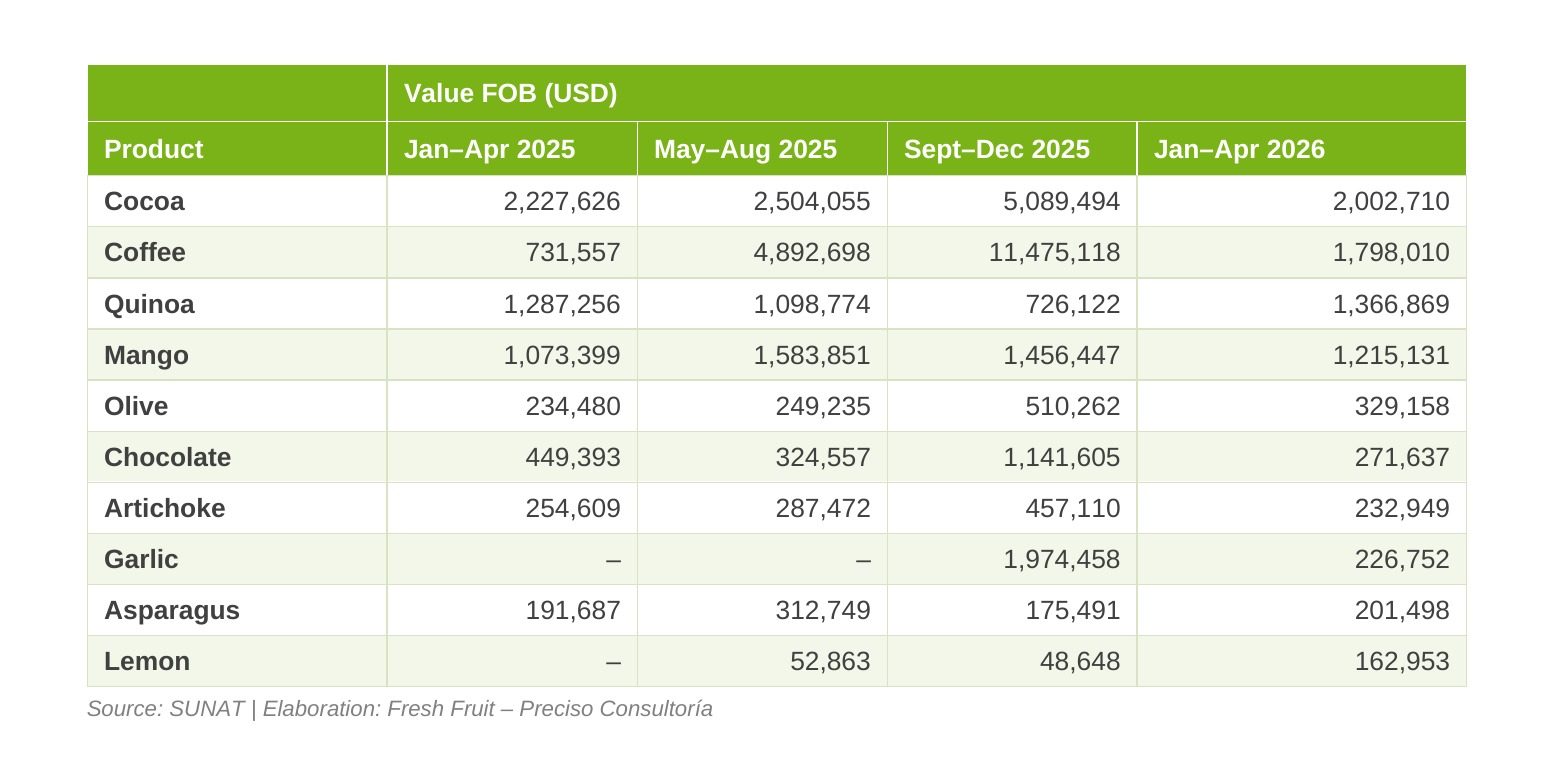
Coffee is the most dramatic illustration of seasonality in the Australian corridor. Exports began at just 731,557 USD in early 2025, climbed to 4.89 million USD in the May–August window, and peaked at 11.48 million USD in September–December 2025 as Peru’s main harvest, which is concentrated between June and September, was processed and shipped. Volumes then fell sharply to 1.80 million USD in early 2026 once the seasonal supply was drawn down. Even so, that early-2026 figure is more than double the equivalent period a year earlier, signalling genuine underlying growth on top of the seasonal cycle. Cocoa follows a related but more muted rhythm, building from 2.23 million USD in early 2025 to a 5.09 million USD peak in late 2025 before settling back to 2.00 million USD in early 2026.
Garlic and lemon capture the volatility of newer or intermittent lines. Garlic registered no shipments through the first eight months of 2025, then surged to 1.97 million USD in September–December 2025 before normalising to 226,752 USD in early 2026, a pattern consistent with a single concentrated harvest-and-ship window. Lemon built gradually from zero in early 2025 to 162,953 USD by early 2026, suggesting an emerging rather than established trade. Chocolate, by contrast, peaked at 1.14 million USD in late 2025 before contracting to 271,637 USD, indicating that its strength is tied to specific seasonal ordering cycles rather than steady year-round demand.
To balance these cyclical lines, quinoa, mango, olive and asparagus provide steadier baselines. Quinoa held within a relatively narrow 0.73 USD–1.37 million USD band across the year and actually reached its highest point in early 2026, reflecting its status as a storable, non-perishable staple with consistent Australian demand. Mango ranged between 1.07 million USD and 1.58 million USD across all four periods, while olive climbed steadily from 234,480 USD to 510,262 USD before easing, and asparagus stayed within a tight 175,491 USD–312,749 USD range. These products give Peruvian exporters a reliable foundation in the Australian market against which the more volatile coffee, cocoa and garlic flows fluctuate.
Overview
Peru has established itself as a growing supplier of agricultural goods to the Australian market, leveraging its biodiversity, year-round production across diverse agroclimatic zones, and the Peru–Australia Free Trade Agreement, which entered into force on 11 February 2020. Under PAFTA, more than 99% of tariffs are being eliminated within five years of entry into force, meaning that by 2025–2026 the large majority of Peruvian agricultural lines now enter their respective markets duty-free or at sharply reduced rates. This progressively improving tariff environment has helped underpin the long-run expansion of the Peru–Australia corridor since 2010.
Peru’s export basket to Australia is anchored by non-perishable, specialty, and processed goods, including cacao, coffee, quinoa, chocolate, and olives. A central reason is biosecurity. Australia operates one of the world’s most restrictive sanitary and phytosanitary regimes, with import conditions set commodity-by-commodity and country-by-country through the Biosecurity Import Conditions system, known as BICON. Some fresh fruits and vegetables are not permitted from certain origins unless market access has been formally assessed, while permitted fresh produce must meet strict phytosanitary, pest-free, packaging, certification, and inspection requirements. These hurdles materially raise the cost, complexity, and lead time of entering fresh-produce categories, and help explain why Peru’s Australian basket skews toward storable, processed, and lower-biosecurity-risk products.
Critically, Australia’s import rules differ sharply by the form in which a product is shipped, whether fresh, frozen, dried, roasted, canned, preserved, processed, or packaged for retail sale. Fresh produce generally faces the highest barrier because it carries greater pest and disease risk, while frozen, dried, and processed products often follow different pathways. Processed and shelf-stable goods such as cacao derivatives, roasted or green coffee, chocolate, packaged quinoa, preserved olives, and canned vegetables sit at the lower-risk end of this spectrum. For Peruvian exporters, this creates a clear strategic implication: the same raw commodity can face very different cost, lead-time, documentation, and approval hurdles depending on whether it is exported fresh, frozen, dried, or processed. In many cases, shipping in a more processed or shelf-stable form may provide a faster, cheaper, and more reliable route into the Australian market.
Recent regulatory developments make this product-form distinction even more important. On 14 June 2025, Australia completed the inclusion of imported food safety requirements in BICON, making the platform a central reference point for both biosecurity import conditions and food safety requirements. The system now provides food safety information related to documentation required before import, analytical tests that may apply on arrival, and obligations following imported food inspection. This reinforces the need for Peruvian exporters to assess each product not only by category, but also by form, intended use, processing level, and required documentation before shipment.
Layered on top of biosecurity are Australia’s food-safety and labelling standards. All imported food for sale must comply with the Australia New Zealand Food Standards Code, administered by Food Standards Australia New Zealand, and is monitored at the border through the Imported Food Inspection Scheme. Consignments classified as higher risk may be subject to higher rates of inspection, while products that fail inspection can face increased scrutiny in future shipments. Separately, Australia’s mandatory Country of Origin Labelling standard requires imported foods to carry a clear country-of-origin statement, and unpackaged fresh fruit and vegetables must display their origin at point of sale. For Peruvian exporters, this is double-edged: it raises compliance obligations, but it also gives well-positioned origins visible shelf identity with increasingly origin-aware Australian shoppers.
Packaged-food labelling is also becoming more relevant. In February 2026, Australia and New Zealand Food Ministers noted that the voluntary Health Star Rating system had not met its final uptake target, with only 39% of intended products in Australia and 36% in New Zealand displaying the rating, compared with the 70% target. Ministers requested that FSANZ prepare a proposal to consider making Health Star Rating labelling mandatory in the Food Standards Code. For Peru, this potential shift is particularly relevant for consumer-facing products such as quinoa, chocolate, coffee, cacao products, olives, and processed vegetables, where nutrition information, product claims, and front-of-pack communication may increasingly affect market readiness.
Consumer behaviour reinforces the opportunity in Peru’s strongest categories. Australia’s coffee market has shown strong demand for specialty, organic, and differentiated products, which aligns with Peru’s single-origin and organic coffee credentials. The chocolate and cacao market also presents opportunities as consumers increasingly value ethical sourcing, traceability, and premium quality. Quinoa demand is supported by the rise of plant-based, gluten-free, and high-protein diets, while Australia’s limited domestic production makes imports important for supply. These trends point to opportunities in categories where Peru can compete through product quality, origin story, nutritional positioning, and value-added processing rather than volume alone.
The retail environment shapes how these trends translate into sales. Australia’s grocery sector is highly concentrated, with Coles and Woolworths controlling a large share of the market, meaning that securing relationships with a small number of major buyers is critical for shelf presence. At the same time, cost-of-living pressure has made Australian consumers more price-sensitive, requiring exporters to communicate a clear value-per-cost proposition. For Peru, this means that premium positioning must be balanced with affordability, consistency, and reliability. The strongest opportunity lies in products such as coffee, cacao, chocolate, quinoa, olives, and preserved vegetables, where Australian demand growth, ethical-sourcing sentiment, import dependence, and Peru’s export strengths are most closely aligned.
Overall, Australia should be viewed as a selective, high-standard market where Peru’s opportunity depends not only on demand, but also on compliance readiness. Strict biosecurity and food-safety requirements raise barriers to entry, particularly for fresh or minimally processed products, but they also reward exporters that can provide traceability, clear documentation, certification, reliable product specifications, and market-ready packaging. Peru can leverage this environment by prioritizing product forms that align with Australia’s regulatory pathways, especially specialty, shelf-stable, processed, and value-added goods. In this context, Peru’s advantage lies not only in what it produces, but in how effectively it can position those products as high-quality, traceable, and compliance-ready for a demanding Australian market.