MONTHLY EXPORTS (ACCUMULATED)
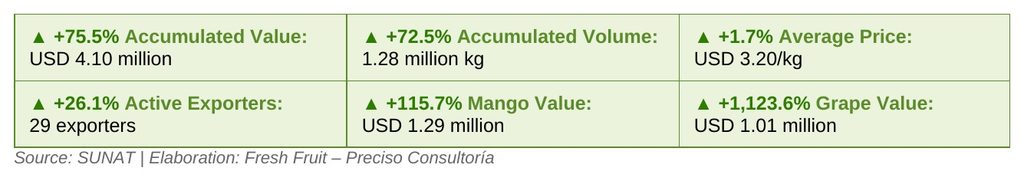
Between January and April 2026, Peruvian agricultural exports to New Zealand totalled USD 4.10 million, an increase of 75.5% from USD 2.34 million during the same period in 2025. This expansion was driven by both higher shipment volumes and a modestly firmer average price. Total export volume rose 72.5% year-over-year, from approximately 743,117 kilograms to 1,281,855 kilograms, while the average export price edged up from USD 3.15 per kilogram to USD 3.20 per kilogram. In contrast to several other Pacific corridors, where headline value gains were a result of price alone, New Zealand’s result reflects genuine volume growth. The number of active exporters increased from 23 to 29, indicating broader participation among Peruvian companies serving the New Zealand market.
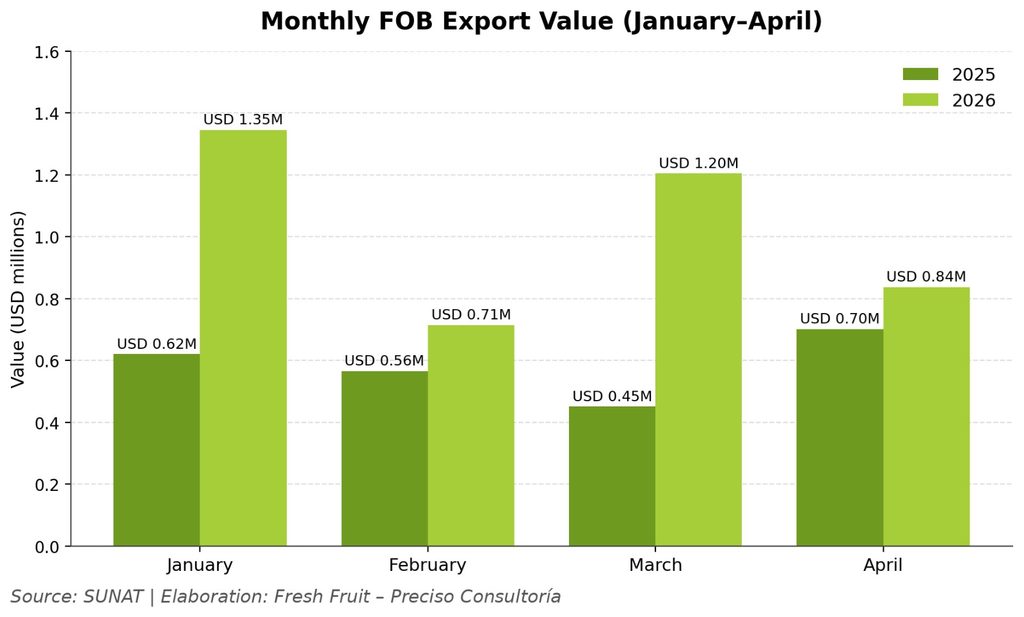
At the monthly level, January recorded the highest export value of the first four months of 2026, reaching USD 1.35 million, compared with USD 0.62 million in January 2025, a year-over-year increase of 117%. March posted an even steeper gain, climbing from USD 0.45 million to USD 1.20 million (+167.2%), the strongest monthly growth rate of the period. February rose more moderately, from USD 0.56 million to USD 0.71 million (+26.4%), while April advanced from USD 0.70 million to USD 0.84 million (+19.4%). Unlike corridors where momentum faded after a strong start, New Zealand recorded year-over-year growth in every month of the period, underscoring the breadth of the 2026 acceleration.
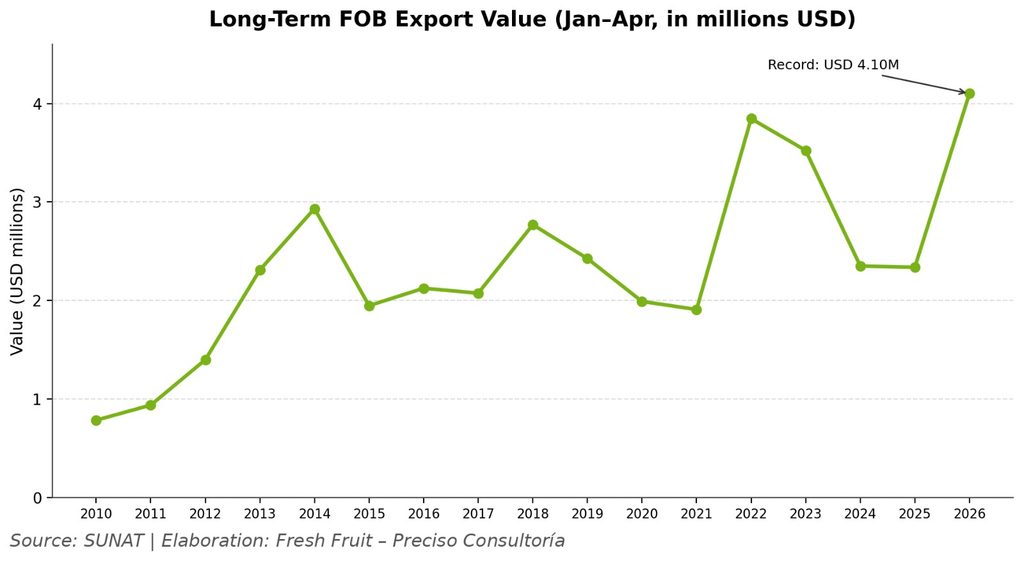
From a longer-term perspective, Peruvian exports to New Zealand during the January–April window have trended broadly upward since 2010, rising from USD 0.78 million in 2010 to USD 4.10 million in 2026. The series has not been linear; after an early peak of USD 3.85 million in 2022, exports eased to USD 3.52 million in 2023 and then fell back to roughly USD 2.35 million in both 2024 and 2025 before the sharp 2026 rebound. The 2026 figure is the highest on record for the period and roughly 5.2 times the 2010 level, indicating sustained structural expansion in the Peru–New Zealand agricultural corridor.
KEY INDICATORS (JANUARY–APRIL)
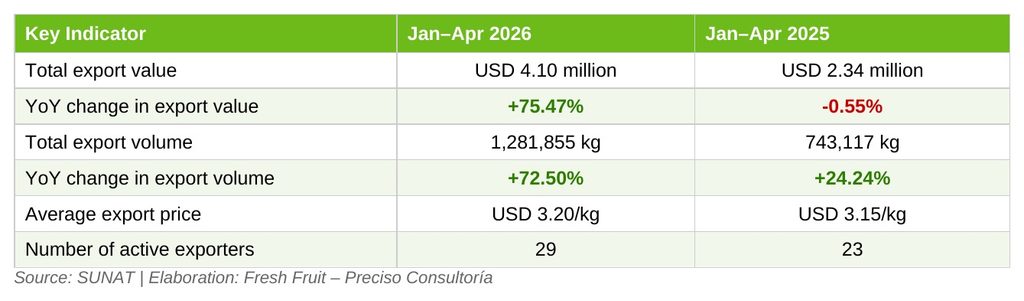
The key indicators show that Peru’s export growth to New Zealand in January–April 2026 was primarily volume driven rather than price-driven. While the average export price increased only slightly, total export volume rose by more than 70%, closely matching the increase in export value. This suggests that the 2026 rebound reflects stronger shipment activity and broader market participation, rather than a temporary price effect. The increase in active exporters also points to a widening base of Peruvian companies engaging with the New Zealand market.
MAIN PRODUCTS EXPORTED TO NEW ZEALAND (JANUARY–APRIL 2026)
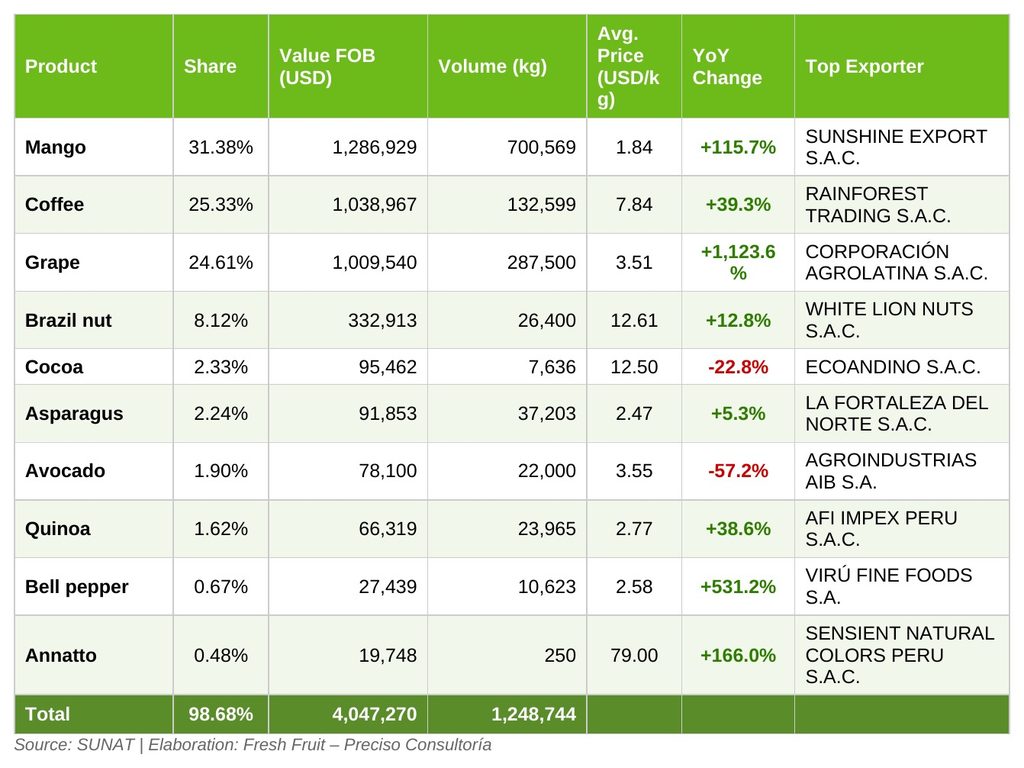
Between January and April 2026, Peru’s exports to New Zealand were led by a concentrated group of fruit, nut, and specialty food products. The ten main products accounted for roughly 98.7% of total export value, a markedly higher concentration than in comparable Pacific markets, reflecting a smaller and more focused trade relationship. Mango, coffee, and grapes alone accounted for 81.3% of total exports, making them the principal drivers of Peru’s trade performance with New Zealand during the period.
Mango ranked as the leading export product, with shipments totalling USD 1.29 million, equivalent to 31.38% of total exports, and the category more than doubled year-over-year, surging 115.7% from USD 596,741 in the same period of 2025. Unusually, this growth was supported by both higher shipment volume and stronger pricing, with the average price rising from USD 1.39/kg to USD 1.84/kg, marking mango out as the strongest anchor product in Peru’s New Zealand basket. It is also a defining structural feature of the corridor: unlike several other developed markets that restrict fresh tropical fruit, Peru holds an established import pathway for fresh mango into New Zealand, allowing it to compete in a high-volume fresh category rather than relying on processed forms alone. Coffee followed in second place with USD 1.04 million and a 25.33% share, up 39.3% year-over-year; its growth was more moderate than mango or grape, but coffee remains structurally important because of its higher unit value and shelf-stable nature. Grape ranked third at USD 1.01 million (24.61% share) and posted the most dramatic increase in the table, expanding more than twelvefold (+1,123.6%) from a small USD 82,503 base a year earlier, with volume rising from 24,960 kg to 287,500 kg. Because the percentage gain is amplified by that low 2025 base, grape is best interpreted as a breakout signal rather than a fully established trend.
Brazil nut occupied fourth position at USD 332,913 (8.12% share, +12.8%), the leading high-value specialty line in the basket. Several mid-sized and emerging categories also contributed. Bell pepper surged 531.2% to USD 27,439 and annatto rose 166.0% to USD 19,748, both off small bases, while quinoa advanced 38.6% to USD 66,319. In contrast, avocado fell 57.2% to USD 78,100 and cocoa declined 22.8% to USD 95,462, the two largest contractions among the leading products. (Note: the source file reports coffee volume change as -81.07%; the underlying figures of 93,480 kg in 2025 and 132,599 kg in 2026 instead imply a +41.85% increase, which has been used here.)
Average export prices varied considerably across the top products. Annatto recorded by far the highest average price at USD 79.00/kg as a concentrated natural-colour extract shipped in very small quantities, followed by Brazil nut at USD 12.61/kg, cocoa at USD 12.50/kg, and coffee at USD 7.84/kg. These higher-priced, value-added and specialty categories generated meaningful export value from comparatively modest volumes. By contrast, mango, grape, avocado, asparagus, quinoa, and bell pepper reflected larger-volume, lower-priced export profiles. The composition shows that Peru’s exports to New Zealand combine genuine fresh-produce strength, led by mango and grape, with a robust specialty and processed tail of nuts, coffee, cocoa, and natural ingredients.
Taken together, mango, coffee, and grape provided the bulk of value and grape the strongest momentum, but the results also underline that New Zealand remains a small and highly concentrated market in which large percentage swings can be driven by a limited number of products, exporters, or individual shipments. Year-over year figures should therefore be read with that volatility in mind.
PERUVIAN AGRICULTURAL EXPORTS TO NEW ZEALAND: FOB PERFORMANCE ANALYSIS (JAN 2025 – APR 2026)
Peru’s top agricultural exports to New Zealand show distinct variation across the four periods analysed, reflecting the sharp seasonality of Peruvian agriculture and the timing of demand in the New Zealand market. While some products display clear cyclical behaviour tied to harvest windows, others provide steadier baselines in the trade relationship.
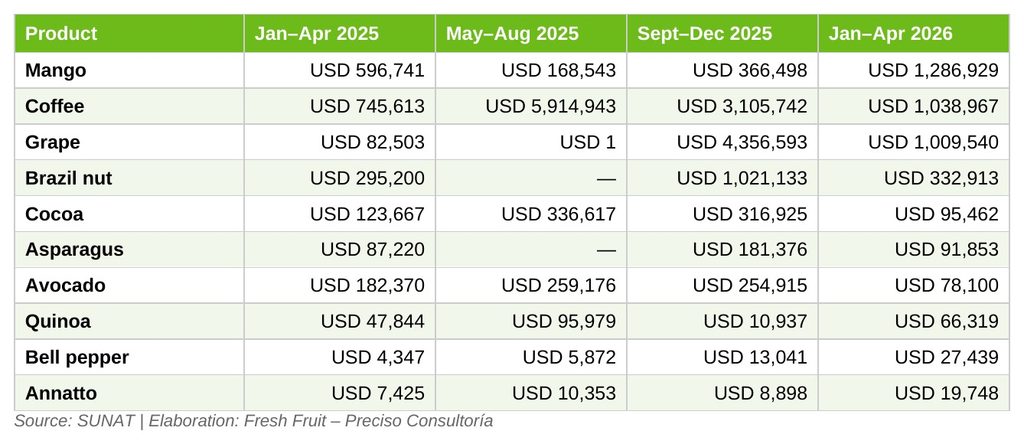
Coffee is the most dramatic illustration of seasonality in the New Zealand corridor. Exports began at USD 745,613 in early 2025, climbed to USD 5.91 million in the May–August window, and remained elevated at USD 3.11 million in September–December 2025 as Peru’s main harvest, concentrated between June and September, was processed and shipped. Shipments then fell back to USD 1.04 million in early 2026 once the seasonal supply was drawn down. Even so, that early-2026 figure is well above the equivalent period a year earlier, signalling genuine underlying growth on top of the seasonal cycle.
Grape captures the volatility of a newly emerging line. Shipments were negligible through the first eight months of 2025, then surged to USD 4.36 million in September–December 2025, aligning with the southern-hemisphere table-grape harvest, before normalising to USD 1.01 million in early 2026, a pattern consistent with a concentrated harvest-and-ship window. Brazil nut shows a related rhythm, registering USD 295,200 in early 2025, no shipments in the mid-year window, then a USD 1.02 million peak in late 2025 before easing to USD 332,913. Mango, by contrast, peaks sharply in the January–April window, reaching USD 1.29 million in early 2026 from a low of USD 168,543 in mid-2025, reflecting the timing of Peru’s fresh mango season and its arrival into New Zealand during the southern summer.
To balance these cyclical lines, cocoa, avocado, quinoa, and the smaller specialty categories provide steadier baselines. Cocoa held within a USD 0.10–0.34 million band across the year, while avocado ranged between USD 78,100 and USD 259,176 and quinoa, bell pepper, and annatto contributed consistent, if modest, year-round flows. These products give Peruvian exporters a reliable foundation in the New Zealand market against which the more volatile coffee, grape, and Brazil nut flows fluctuate.
The seasonality data reinforces the need to interpret New Zealand’s year-over-year growth carefully. Because several categories, notably coffee, grape, and Brazil nut, are shipped unevenly across the year and concentrate in the second half, a January–April comparison can exaggerate growth or decline depending purely on shipment timing. This effect is magnified in a small market, where a handful of shipments can materially move total value. The strong 2026 result should therefore be read as a robust early-year signal rather than confirmation of a fully mature, stable corridor.
OVERVIEW
Peru has established itself as a growing supplier of agricultural goods to the New Zealand market, leveraging its biodiversity, year-round production across diverse agroclimatic zones, and the Comprehensive and Progressive Agreement for Trans-Pacific Partnership (CPTPP), which entered into force for Peru on 19 September 2021. CPTPP is the first trade agreement between Peru and New Zealand, and under it the large majority of tariff lines are being progressively eliminated. By 2025–2026, most Peruvian agricultural lines now enter New Zealand duty free or at sharply reduced rates. This improving tariff environment has helped underpin the long-run expansion of the Peru–New Zealand corridor and the sharp 2026 rebound in particular.
A defining feature of the New Zealand market sets it apart from several other developed economies: Peru already holds established fresh-produce access for key categories. New Zealand’s Ministry for Primary Industries (MPI) maintains a country- and commodity-specific import health standard (IHS) for fresh mango from Peru under the Biosecurity Act 1993, which is precisely why mango is Peru’s single largest export to New Zealand at 31% of value. Where some markets confine Peru’s basket to processed and shelf-stable goods, the New Zealand pathway allows Peru to compete in high-volume fresh categories such as mango and grape alongside its specialty and processed lines. This fresh-plus-specialty structure is the corridor’s central strategic advantage.
New Zealand nonetheless operates a rigorous biosecurity regime. Under the Biosecurity Act 1993, any biosecurity risk goods, including fresh fruit and vegetables, require a relevant IHS specifying the measures that must be applied in the exporting country and on arrival. Permitted fresh produce must meet strict phytosanitary, pest-free, treatment, packaging, certification, and inspection requirements, with consignments held in transitional facilities pending clearance and non-compliant goods subject to treatment, re-shipment, or destruction. These requirements materially raise the cost, complexity, and lead time of fresh-produce entry, and they reward exporters that can demonstrate consistent compliance and traceability. Importantly, the form in which a product is shipped, whether fresh, frozen, dried, roasted, processed, or packaged, can determine the applicable pathway, documentation, and approval timeline. For many lines, a more processed or shelf-stable form provides a faster and more predictable route to market, while established fresh pathways such as mango reward investment in approved treatment and certification capacity.
Layered on top of biosecurity are shared food-safety and labelling standards. New Zealand applies the Australia New Zealand Food Standards Code, administered jointly through Food Standards Australia New Zealand (FSANZ) and enforced domestically by MPI. All imported food for sale must comply with the Code, and consignments are monitored at the border, with higher-risk products subject to higher inspection rates and a record of failures increasing future scrutiny. New Zealand also operates country-of-origin labelling requirements for many foods, which is double-edged for Peruvian exporters: it raises compliance obligations, but it also gives well-positioned origins visible shelf identity with increasingly origin-aware New Zealand shoppers.
Packaged-food labelling is becoming more relevant across the trans-Tasman market. In February 2026, Australian and New Zealand Food Ministers noted that the voluntary Health Star Rating system had not met its uptake target, with only 36% of intended products in New Zealand displaying the rating against a 70% goal, and asked FSANZ to consider making the rating mandatory in the Food Standards Code. For Peru, this potential shift is particularly relevant for consumer-facing products such as coffee, cacao products, chocolate, quinoa, and processed vegetables, where nutrition information, product claims, and front-of-pack communication may increasingly affect market readiness.
Consumer behaviour reinforces the opportunity in Peru’s strongest categories. New Zealand has a deeply embedded café culture and one of the highest per-capita specialty-coffee consumption levels in the world, with strong demand for single-origin, organic, and traceable beans that aligns directly with Peru’s organic and single origin coffee credentials. The chocolate and cacao market rewards ethical sourcing, traceability, and premium quality, while demand for quinoa is supported by the rise of plant-based, gluten-free, and high-protein diets, against limited domestic production. New Zealand’s strong fresh-fruit consumption and counter-seasonal southern-hemisphere supply window also create room for Peruvian mango and grape during periods when local and other southern-hemisphere supply is constrained. These trends point to opportunities in categories where Peru can compete through quality, origin story, nutritional positioning, and reliable counter-seasonal supply rather than price alone.
The retail environment shapes how these trends translate into sales. New Zealand’s grocery sector is highly concentrated, with Foodstuffs and Woolworths New Zealand together holding roughly 82% of the market, rising to around 88% outside Auckland. Securing relationships with this small group of major buyers is therefore critical for shelf presence, and recent regulatory reform through the Grocery Commissioner has aimed to improve supplier terms. At the same time, cost-of-living pressure has made New Zealand consumers more price-sensitive, requiring exporters to communicate a clear value-per-cost proposition. For Peru, premium positioning must be balanced with affordability, consistency, and reliability. The strongest alignment lies in mango, grape, coffee, cacao, Brazil nut, and quinoa, where New Zealand demand, ethical-sourcing sentiment, counter-seasonal need, and Peru’s export strengths converge.
New Zealand’s scale and geography reinforce its selective character. It has a relatively small consumer base of around five million people and sits at a long logistical distance from Peru, and as an island economy with a significant agricultural sector it is highly protective against the introduction of pests and disease. The practical consequence for exporters is that the question is not only whether a product can technically clear the border, but whether the expected sales volume justifies the cost, documentation, treatment, inspection, and logistics required to serve the market consistently. This favours products with demonstrated demand, high unit value, lower perishability, shelf stability, or strong origin-based differentiation over those that depend on large volumes or complex fresh pathways, and it explains why the basket pairs seasonal fresh lines such as mango and grape with a durable specialty tail of coffee, Brazil nut, cacao, quinoa, and annatto.
Exporter concentration further shapes the opportunity. Although the number of active exporters rose from 23 to 29, many categories still depend on a single firm: in asparagus, avocado, and quinoa, one exporter accounted for all January–April 2026 shipments, while the leading mango exporter represented 68.4% of that product’s exports and the top grape exporter 53.7%. This concentration makes headline figures more volatile, but it also means that individual exporter–buyer relationships can meaningfully move Peru’s position in New Zealand. The strategic implication is that Peru’s opportunity should be relationship-led: rather than broad promotional efforts across every category, exporters are better served by cultivating a focused set of importers, distributors, coffee roasters, specialty retailers, foodservice buyers, and premium grocery channels capable of building repeat demand. In a market this size, one strong buyer relationship can matter more than broad visibility.
New Zealand can also function as a controlled test market for the wider Oceania region. While its absolute import potential is limited by population, its high standards and import dependence make it a useful environment for testing product positioning, packaging, importer relationships, consumer response, and premium origin-based messaging before scaling into larger neighbouring markets. Success here may come less from immediate volume than from learning which Peruvian products and narratives resonate with demanding, quality-focused buyers.
Overall, New Zealand should be viewed as a small but strategically useful, high-standard market for Peru. It is also unusually open relative to several of Peru’s other developed-market destinations: established fresh-produce access for mango, the rapid emergence of grape, and durable specialty demand for coffee, cacao, and Brazil nut give Peru a broader competitive footing than in markets restricted to processed goods. Strict biosecurity and food-safety requirements raise the threshold for commercial viability, but they reward exporters that can provide traceability, clear documentation, certification, reliable specifications, and market-ready packaging. The early 2026 data shows clear momentum, particularly in mango, grape, and coffee, but the path forward should be selective. Peru’s advantage in New Zealand lies not only in what it produces, but in its ability to combine approved fresh pathways with high-quality, traceable, compliance-ready specialty goods, and to pursue the products whose value, quality, shelf stability, seasonality, or differentiation make the market commercially worth developing despite its small size.