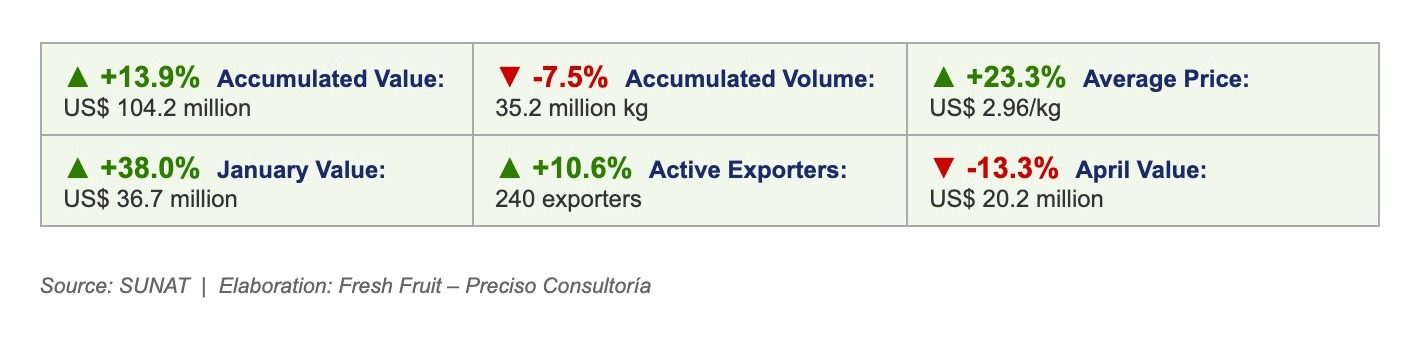
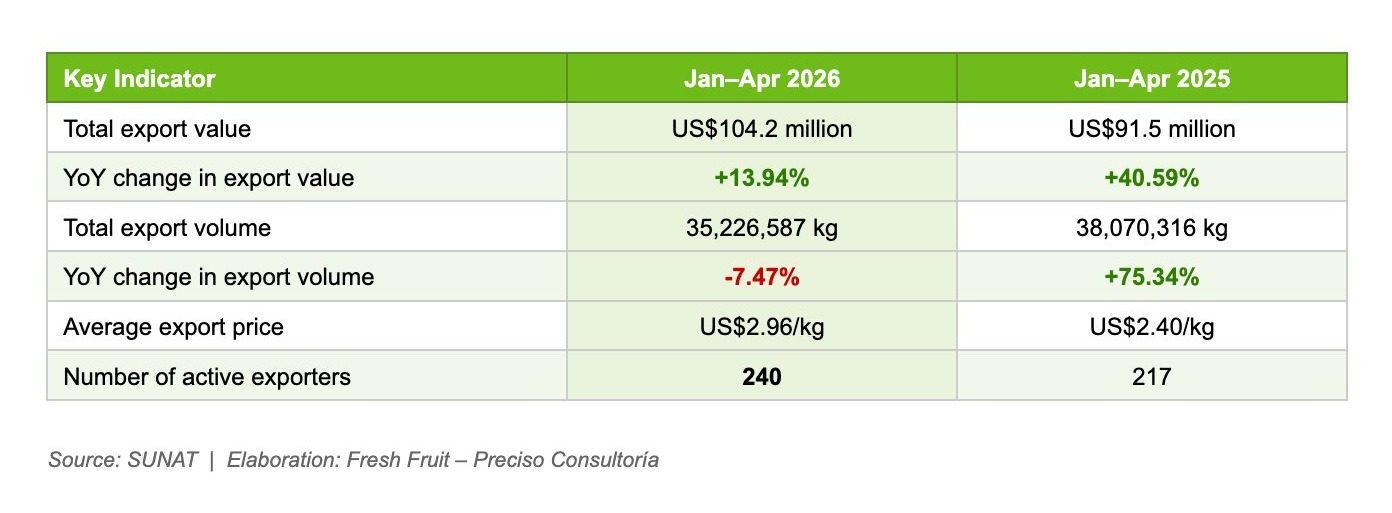
Between January and April 2026, Peruvian exports to Canada totalled US$104.2 million, an increase of 13.9% from US$91.5 million during the same period in 2025. This growth in value occurred despite a 7.5% year-over-year decline in total export volume, from approximately 38.1 million kilograms to 35.2 million kilograms. The increase in export value was therefore driven primarily by a higher average export price rather than by higher shipment volume. The average export price rose from US$2.40 per kilogram in January–April 2025 to US$2.96 per kilogram in January–April 2026. This suggests that the export trends to Canada either shifted toward higher-value products, experienced stronger pricing for key exports, or reflected a combination of both factors. The number of active exporters also increased from 217 to 240, indicating broader participation among Peruvian companies exporting to the Canadian market.
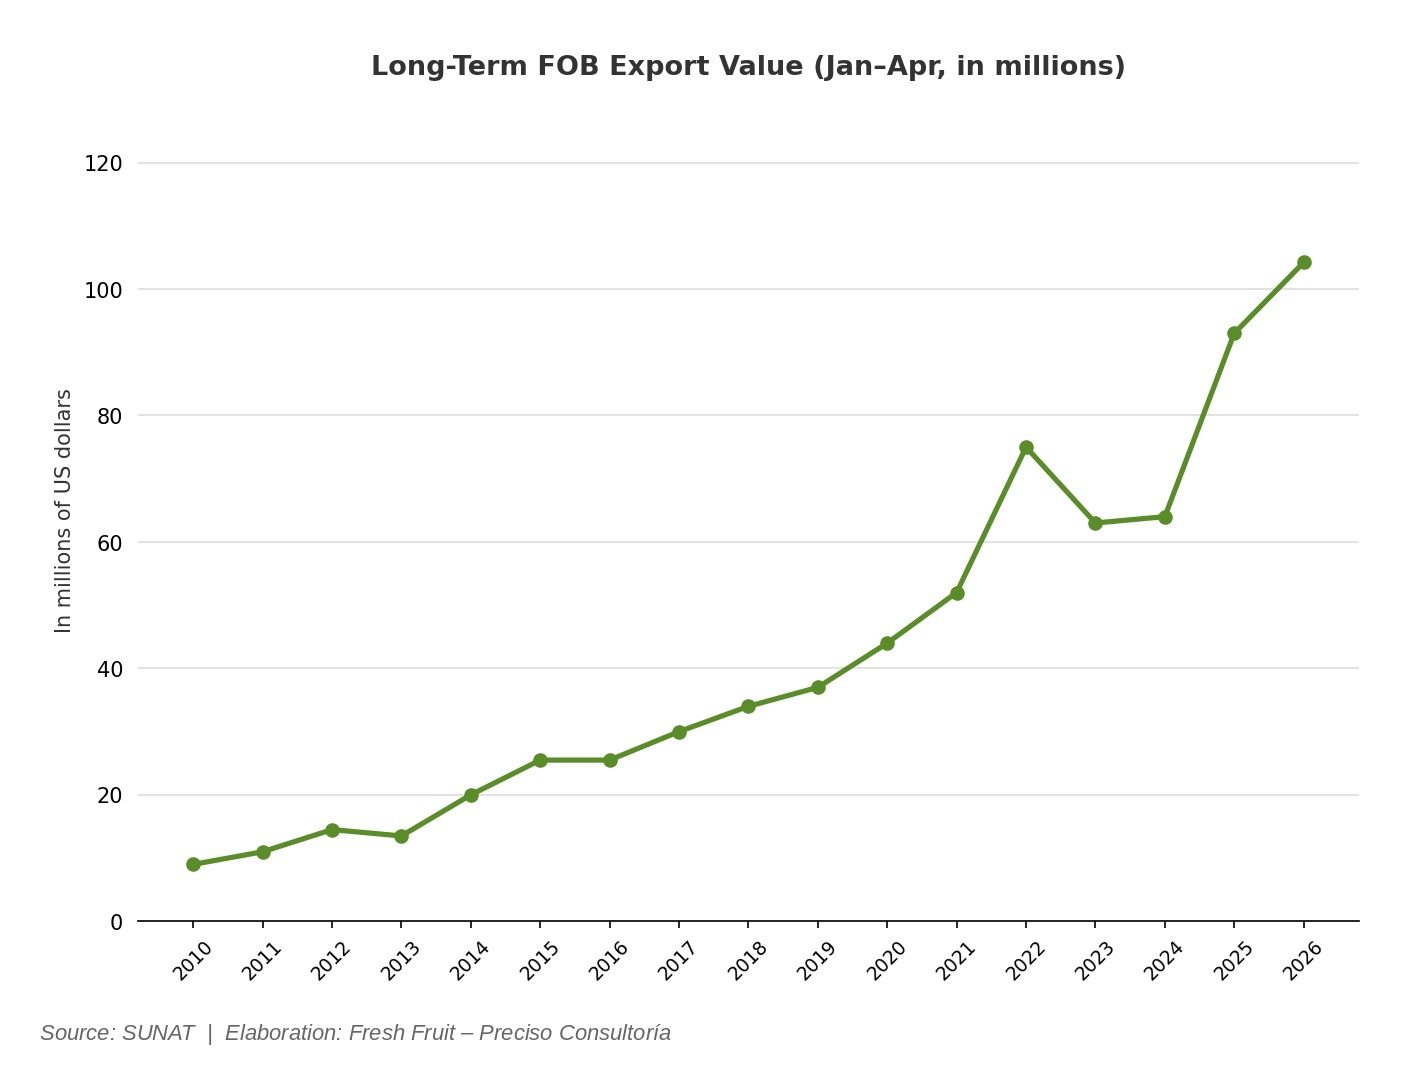
From a longer-term perspective, Peruvian exports to Canada have generally trended upward during the January–April period since 2010. Export values increased gradually through much of the first decade shown, followed by more pronounced growth after 2020. While the trend has not been entirely linear, with a decline after the 2023 level, the overall direction indicates sustained expansion in Peru’s exports to Canada. In January–April 2026, exports reached their highest level to date, surpassing US$100 million for the first time.
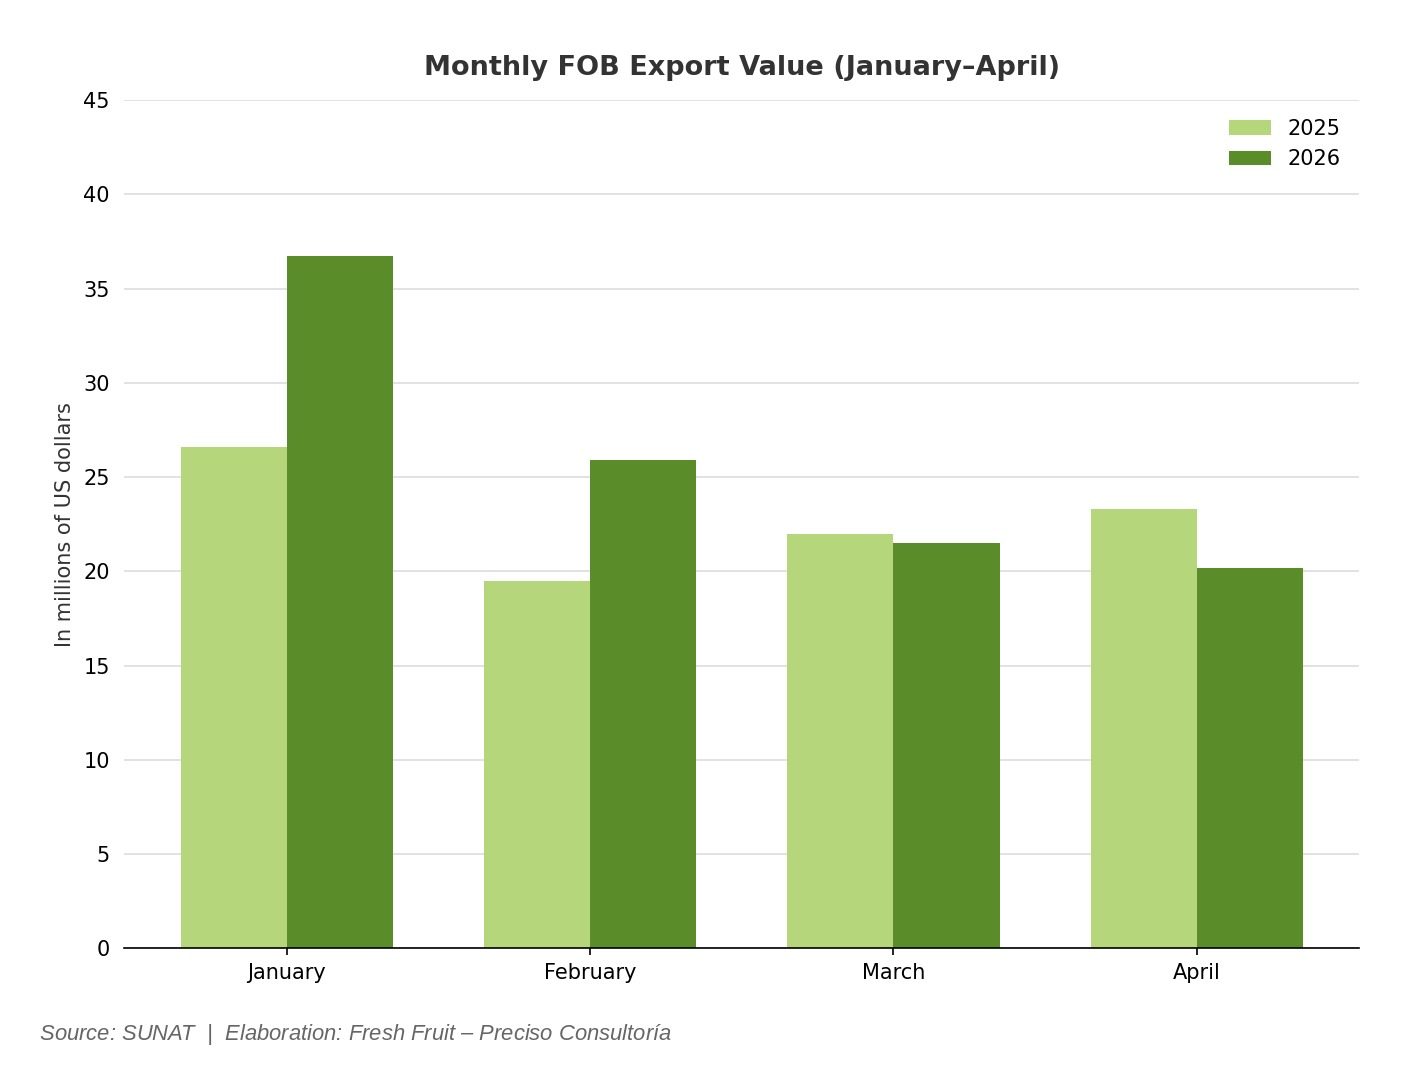
At the monthly level, January recorded the highest export value of the first four months of 2026, reaching US$36.7 million, compared with US$26.6 million in January 2025. February also showed year-over-year growth, increasing from US$19.5 million to US$25.9 million. In contrast, March and April recorded lower values than the previous year. March declined slightly from US$22.0 million to US$21.5 million, while April fell from US$23.3 million to US$20.2 million.
Overall, the January–April 2026 result was supported mainly by stronger performance in the first two months of the year. Although total export value increased across the four-month period, the monthly distribution shows that growth was not evenly spread across all months. The combination of higher export value, lower volume, and a higher average price makes product-level analysis necessary to determine whether the increase was concentrated in specific high-value categories or reflected broader pricing changes across Peru’s exports to Canada.
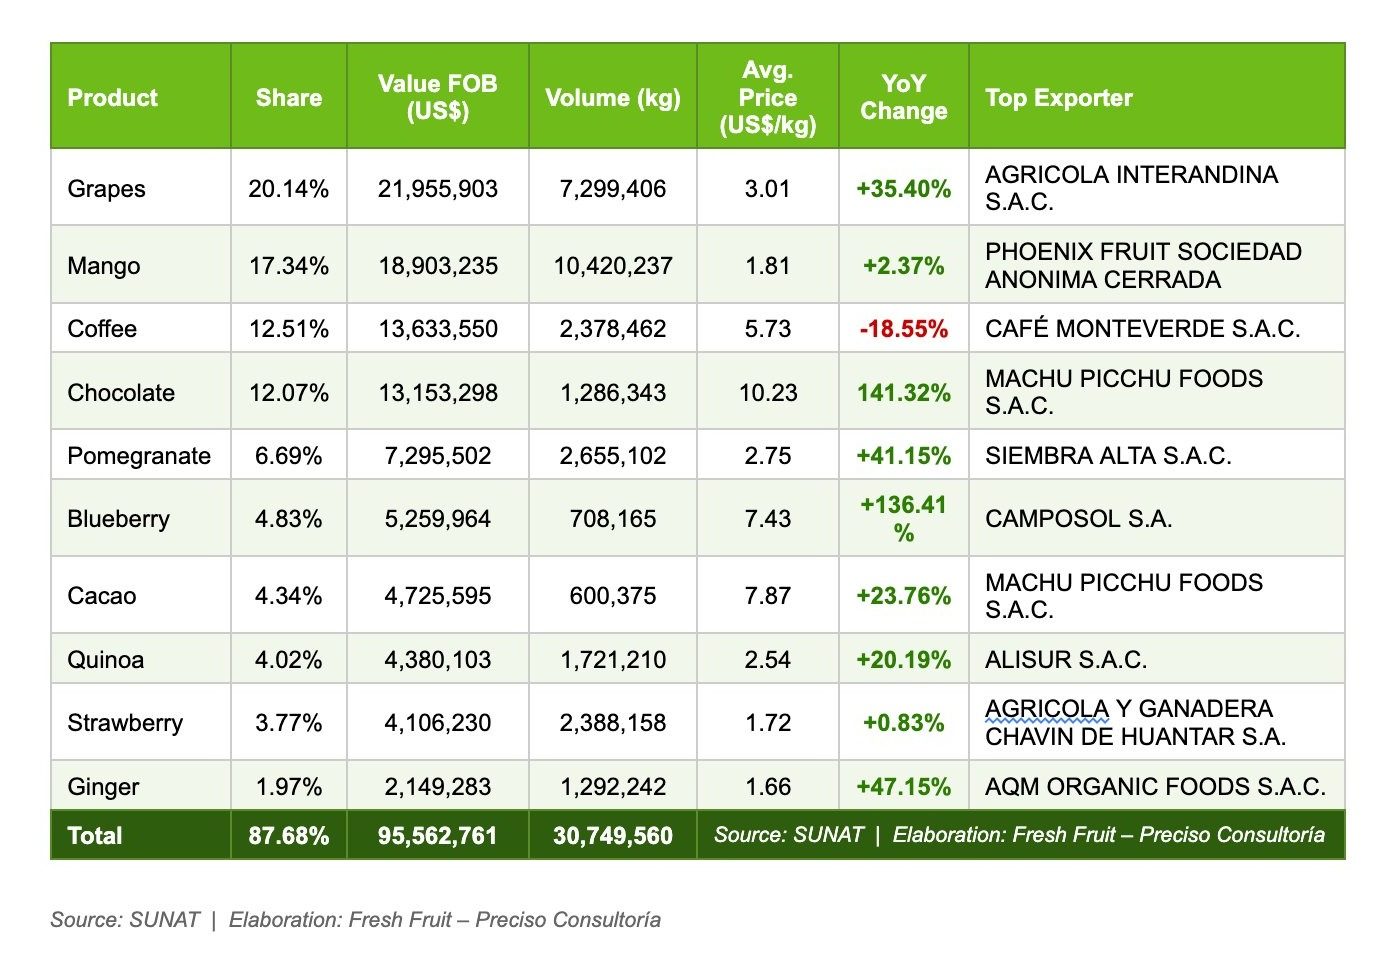
Between January and April 2026, Peru’s exports to Canada were led by a concentrated group of agricultural and food-based products. The ten main products accounted for 88.67% of the total export value, indicating that the export basket was highly concentrated in a limited number of categories. Grapes, mango, coffee, and chocolate alone accounted for 62.32% of total exports, making them the principal drivers of Peru’s trade performance with Canada during the period.
Grapes ranked as the leading export product, with shipments totalling US$21.8 million, equivalent to 20.95% of total exports. The category recorded a year-over-year increase of 35.40%, reinforcing its position as a key contributor to the overall expansion in export value. Mango followed in second place, with US$17.8 million and a 17.10% share. However, its growth was comparatively moderate at 2.37%, suggesting a more stable performance relative to faster-growing categories.
Coffee and chocolate occupied the third and fourth positions, with similar shares of total exports at 12.19% and 12.08%, respectively. Coffee exports reached US$12.6 million, but declined by 18.55% compared with the same period in 2025, making it the only product among the top ten to register a contraction in value. In contrast, chocolate exports totalled US$12.7 million and recorded the strongest year-over-year increase in the table, rising by 141.32%. This performance points to a significant expansion of value-added food exports within the Canadian market.
Several mid-sized categories also contributed meaningfully to the overall export performance. Pomegranate exports reached US$7.1 million, representing 6.84% of total exports and increasing by 41.15% year-over-year. Blueberries totalled US$5.2 million, with a 4.99% share and growth of 136.41%. Although these products accounted for smaller shares than grapes and mangoes, their growth rates indicate rising momentum in selected fruit categories.
Average export prices varied considerably across the top products. Chocolate recorded the highest average price at US$10.29/kg, followed by cacao at US$7.92/kg, blueberries at US$7.61/kg, and coffee at US$6.31/kg. These products generated relatively high export value despite lower shipment volumes, suggesting that higher-priced categories played an important role in supporting the overall increase in export value. By contrast, mango, strawberry, and ginger recorded lower average prices, reflecting larger volumes and lower-priced export profiles.
The composition of the top ten products shows that Peru’s exports to Canada are supported by both fresh agricultural goods and higher-value food products. Grapes, mangoes, pomegranates, blueberries, strawberries, and ginger reflect Peru’s continued strength in fresh produce, while coffee, chocolate, cacao, and quinoa highlight the role of specialty and value-added categories. This mix is particularly relevant given that total export value increased while total export volume declined, suggesting that pricing and product composition were important factors behind the period’s performance.
Overall, Peru’s exports to Canada in January–April 2026 were led by grapes and mango in terms of value, while the strongest growth came from chocolate, blueberries, ginger, and pomegranate. The decline in coffee demonstrates that performance was not uniform across all major categories. Taken together, the results suggest that Peru’s export growth to Canada was driven by a combination of established fresh-produce exports and rapid expansion in selected higher-value segments.
Peru’s top agricultural exports to Canada show distinct variation across the four periods analyzed, reflecting changes in product demand in the Canadian market and the sharp seasonality of Peruvian agriculture. While some products display a high growth trend, other variances are explained by fluctuations in harvest cycles.
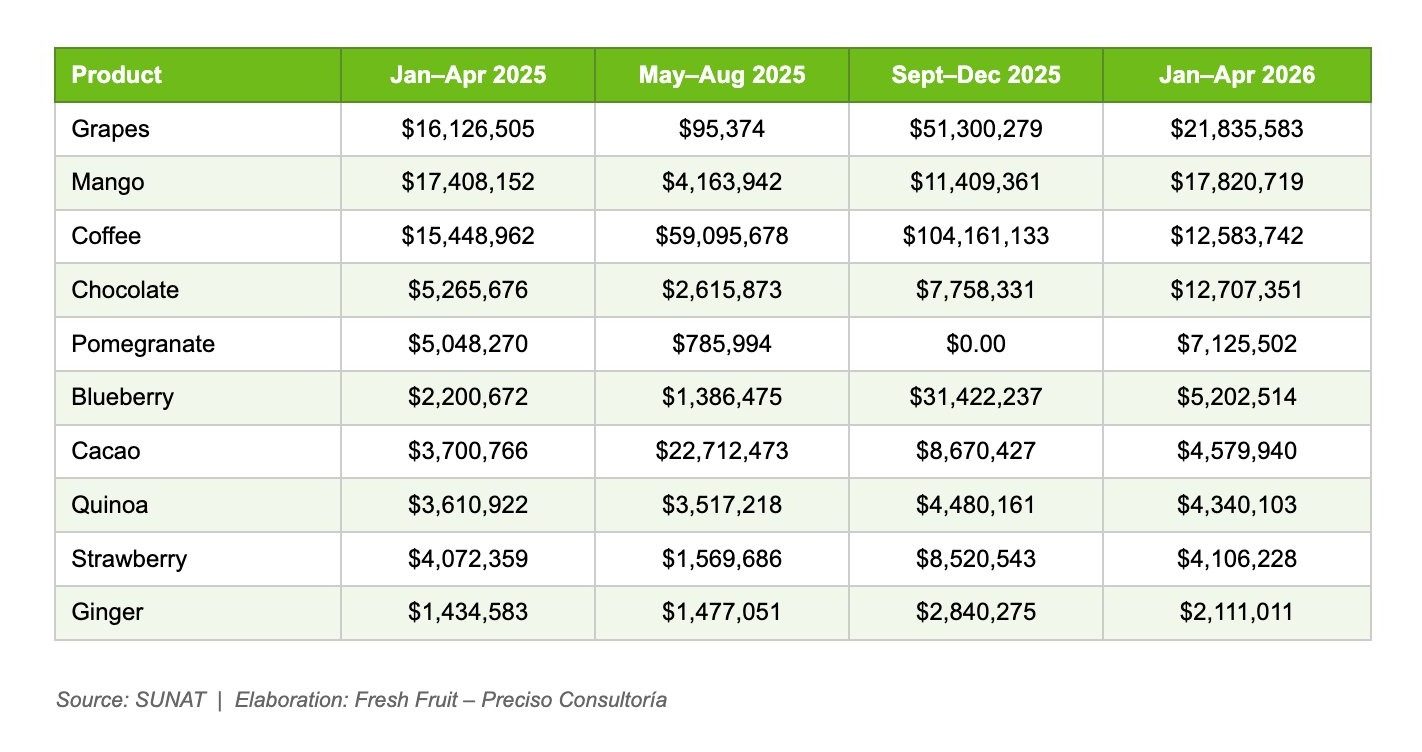
Grapes and Mangos are leading Peruvian exports to Canada, exhibiting sharp cyclical behaviour between early 2025 and 2026. Grapes experienced significant growth in the winter market, moving from $16.1M in early 2025 to $21.8M in the same period in 2026. During the interim, exports of grapes plummeted as low as $95.4k during the May to August months, signalling that this period falls entirely outside of Peru’s peak grape harvest window. Mango shows a highly similar trend, starting at $17.4M in early 2025, dipping to a seasonal mid-year low of $4.2M, and recovering to reach $17.8M in early 2026, aligning with favourable climate cycles and the consistent demand for seasonal tropical fruit in Canada.
Seasonality is the primary dictator of peak revenue cycles for high-volatility items like blueberries, cacao, and pomegranates. Blueberries represent an explosive single-season spike, hitting a massive peak of $31.4M in the final months of 2025, aligning directly with Peru’s harvest window, filling Canada’s supply gap during the Northern Hemisphere’s winter season. Similarly, coffee experienced an extraordinary cyclical explosion throughout 2025, starting at $15.4M and climbing to $59.1M mid-year. Because Peru’s main coffee harvest occurs between May and September, concentrated heavily between June and August, the fresh beans require extensive processing before they can be exported. This lag time explains why coffee volumes reached a towering peak of $104.2M in the late months of 2025 as the processed crop finally hit the market, before dropping sharply to $12.6M in early 2026 once the seasonal supply was exhausted. Conversely, cacao reached its seasonal high volume in mid-2025 at $22.7M, driven by heightened production during Peru’s winter months, before settling at $4.6M in early 2026. Meanwhile, pomegranates and strawberries capture different dimensions of this agricultural volatility. Strawberries built steady momentum to peak at $8.5M in late 2025 before receding slightly to $4.1M in early 2026. Pomegranates, however, underwent a dramatic vanishing act, dropping to an absolute $0.00 in the late months of 2025 before staging a powerful rebound to $7.1M in early 2026. Ultimately, these dramatic shifts explain how heavily dependent Peru’s fresh produce sector remains on both precise harvest windows and the shifting import demands of the Canadian winter market.
To balance the volatile seasonality of those fresh and cyclic products, chocolate, quinoa, and ginger represent much steadier trends in export, providing reliable baselines in the trade relationship. Quinoa and ginger remained the most stable items on the list; quinoa consistently generated between $3.5M and $4.5M per season, reflecting its status as a growing non-perishable staple, while ginger showed steady, incremental growth from $1.4M to $2.1M over the year. Meanwhile, the consistent upward trajectory in chocolate exports, rising steadily from $5.3M to $12.7M during the year, highlights a highly successful shift toward value-added trade, supported by Canada’s expanding domestic appetite for high-end processed Peruvian chocolate.
Overview
Peru has established itself as a dynamic and growing supplier of agricultural goods to the Canadian market, leveraging its rich biodiversity and year-round production capacity across diverse agroclimatic zones. The Andean country’s agricultural sector is characterized by a broad range of export-ready products, including fresh fruits, specialty beverages, and processed foods, many of which benefit from Peru’s free trade agreement with Canada, which has progressively reduced tariff barriers and enhanced market access since its entry into force.
The consistent expansion of Peru’s agricultural export value to Canada from 2010 to 2026 reflects structural improvements in the sector, including investment in post-harvest technology, cold chain logistics, and certification standards aligned with Canadian food safety requirements. Grapes and mangoes have traditionally anchored the export basket, capitalising on complementary seasonality with Canada’s Northern Hemisphere supply gap. More recently, the rapid growth of value-added categories such as chocolate and processed cacao products signals a maturation of the bilateral trade relationship toward higher-margin segments.
The current market environment presents a timely opportunity for Peruvian exporters seeking to strengthen their presence in the Canadian market. Recent shifts in Canadian consumer sentiment have contributed to growing interest in product-origin transparency and supply chain diversification. According to a February 2025 Research Co. poll, 63% of Canadians indicated they would seek a non-American alternative when one is available, reflecting a broader trend toward diversified sourcing that is reshaping purchasing patterns across multiple retail categories. This dynamic is particularly relevant in fresh produce, where Canadian consumers are increasingly attentive to country-of-origin labels and open to exploring a wider range of supply origins. While the United States remains an important and highly visible supplier of fresh produce to Canada, this shift in consumer awareness creates space for other trusted partners to build stronger recognition on Canadian shelves. For Peru, this represents an opportunity to differentiate through the strengths it already holds: product quality, seasonal complementarity, and supply reliability. Products such as blueberries, grapes, mangoes, and pomegranates are well-positioned to benefit from stronger origin-based promotion, particularly as retailers and importers seek to broaden their sourcing portfolios in response to evolving consumer preferences. Rather than displacing existing trade relationships, this opportunity is best understood as part of a natural market evolution, one in which Peruvian produce can earn greater visibility by meeting the demand of Canadian consumers who are increasingly engaged with where their food comes from and interested in accessing a diverse range of high-quality options.
Canadian grocery shelves are heavily supplied by the United States, Mexico, and Guatemala. On average, about 75% of fruits consumed in Canada are imported, and the United States alone accounts for nearly half of Canada’s fruit import market, followed by Mexico, with Peru ranking among the next tier of suppliers. While Peru already has a foothold in the Canadian market, its retail visibility remains limited relative to its nearest competitors, representing a significant untapped opportunity. With food prices 27% higher than five years ago and forecasted to continue rising in 2026, building a stronger presence requires Peruvian exporters to communicate a clear value-per-cost proposition and positioning premium Peruvian produce, not as a luxury alternative, but as a quality-consistent, competitively priced option during the precise seasonal windows when US and Mexican supply runs thin. Securing stronger distributor relationships and greater retail visibility within Canada’s concentrated grocery sector represents the most direct path to converting Peru’s already-growing export volumes into lasting shelf presence.
The January–April 2026 results confirm that Peru’s export performance to Canada is increasingly supported by pricing strength and product diversification rather than volume growth alone. With 240 active exporters participating during the period and exports exceeding US$100 million for the first time, the outlook for the Canada corridor remains positive, contingent on sustained competitiveness in high-growth categories and continued adaptation to evolving Canadian consumer preferences.